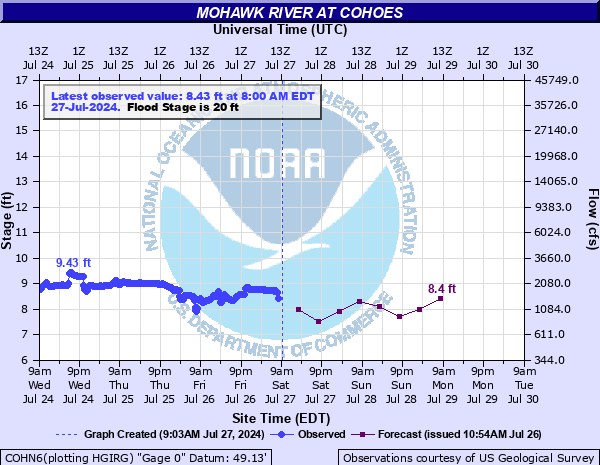
Mohawk River at Cohoes Gauge
Last Update:
3:00am EDT -- May 17, 2024
Page automatically refreshes every 15 minutes.
Latest Observation
Normal
Current Stage:
12.06 ft
Current Flow: 9,620.00 cfs
Historic Observations
Record Stage:
23.15 ft
Record Flow:
143,000.00 cfs
| Time/Date | Stage | Flow | Category |
|---|---|---|---|
| 8:00am EDT -- May 17, 2024 | 11.80 ft | 8,620.00 cfs | Normal |
| 2:00pm EDT -- May 17, 2024 | 11.50 ft | 7,560.00 cfs | Normal |
| 8:00pm EDT -- May 17, 2024 | 11.20 ft | 6,610.00 cfs | Normal |
| 2:00am EDT -- May 18, 2024 | 11.00 ft | 6,020.00 cfs | Normal |
| 8:00am EDT -- May 18, 2024 | 10.80 ft | 5,480.00 cfs | Normal |
| 2:00pm EDT -- May 18, 2024 | 10.60 ft | 4,970.00 cfs | Normal |
| 8:00pm EDT -- May 18, 2024 | 10.50 ft | 4,730.00 cfs | Normal |
| Time/Date | Stage | Flow | Category |
|---|---|---|---|
| 2:45am EDT -- May 17, 2024 | 12.10 ft | 9,790.00 cfs | Normal |
| 2:30am EDT -- May 17, 2024 | 12.11 ft | 9,830.00 cfs | Normal |
| 2:15am EDT -- May 17, 2024 | 12.15 ft | 10,000.00 cfs | Normal |
| 2:00am EDT -- May 17, 2024 | 12.14 ft | 9,950.00 cfs | Normal |
| 1:45am EDT -- May 17, 2024 | 12.14 ft | 9,950.00 cfs | Normal |
| 1:30am EDT -- May 17, 2024 | 12.16 ft | 10,000.00 cfs | Normal |
| 1:15am EDT -- May 17, 2024 | 12.18 ft | 10,100.00 cfs | Normal |
| 1:00am EDT -- May 17, 2024 | 12.19 ft | 10,200.00 cfs | Normal |
| 12:45am EDT -- May 17, 2024 | 12.20 ft | 10,200.00 cfs | Normal |
| 12:30am EDT -- May 17, 2024 | 12.22 ft | 10,300.00 cfs | Normal |
Normal: The water surface is below the top of its banks.
Action: The water surface is generally near or slightly above the top of its banks, but no man-made structures are flooded.
Minor: Minimal or no property damage, but possibly some public threat (e.g., inundation of roads).
Moderate: Some inundation of structures and roads near stream. Some evacuations of people and/or transfer of property to higher elevations.
Major: Extensive inundation of structures and roads. Significant evacuations of people and/or transfer of property to higher elevations.
Flood Stage Impacts
22.00 ft.: Major flood stage.
21.00 ft.: Moderate flood stage.
20.00 ft.: Minor flood stage.
17.50 ft.: The river is bankfull at Schenectady.
17.00 ft.: Action stage.
Hydrograph
Gauge reading affected by power generation.
Gauge reading may be affected by ice. Forecast flows are unadjusted for ice.
Forecasts are issued routinely year-round.
Source National Water Prediction Service / US Geological Survey